
Supply Chain elements
The global trading situation contains multiple risks, so not understanding your organisation’s core and extended supply chains is a risk to the business. To gain this understanding requires an analysis of the main elements within an organisation’s supply chains. These are: customers, finished goods inventory, suppliers and inbound supply items.
For inbound supply items, an increased emphasis must be placed on the structured analysis of supply markets, which includes: risk of non-supply; reliability of supply, location (of supply facilities and input materials), visibility of actions and sustainable processes. This is a focus of Commodity Management.
The previous blogpost discussed suppliers and this blogpost discusses inbound supply items. The knowledge enables Procurement professionals to better understand their supply markets, which assists structuring the most appropriate relationships with selected suppliers.
Analysis process
The process for analysing inbound supply commences with identifying input supply items as ‘direct expense’, supplied by a ‘Supply Industry’ or an ‘indirect expense’, supplied by a ‘Service Provider’. The diagram below illustrates the next step, which is to place the items into their respective supply group, and then segment the groups into appropriate supply Category and sub-Category.
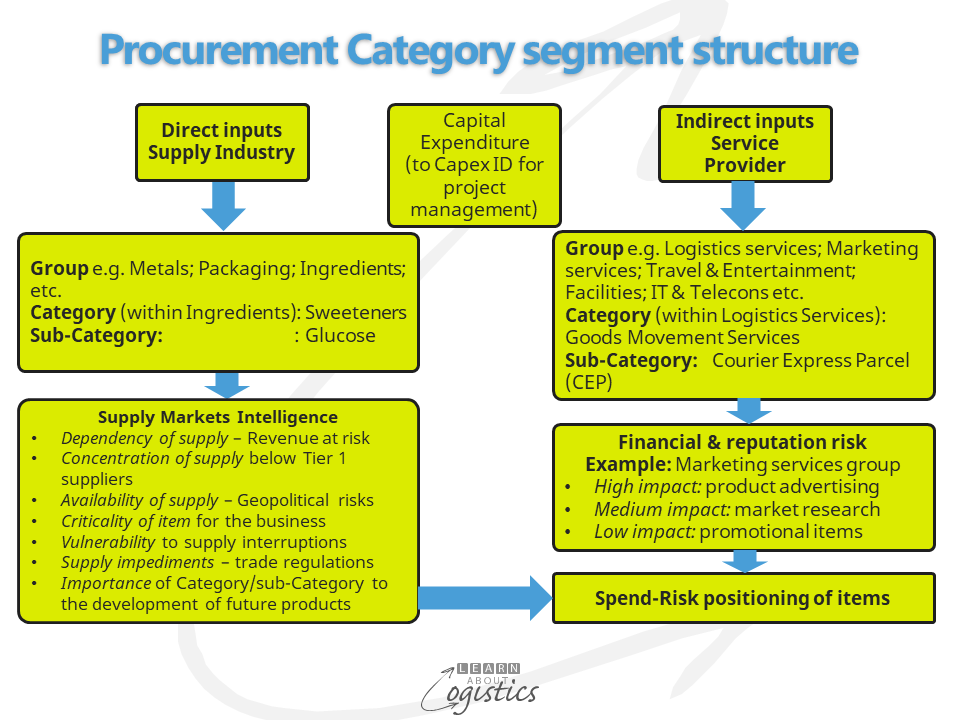
The example in the diagram is from the food industry, segmenting the groups ‘Ingredient’ and ‘Logistics Services’. For an automotive business, the segmentation example can be:
- Within ‘Supply Industry’, there is an ‘Electronics’ group
- A Category is named ‘Semiconductors’
- The items are allocated to one of four sub-Categories: microprocessors, memory chips, commodity integrated circuits and ‘systems on a chip’
Within ‘Service Provider’ the groups are: Logistics services; Marketing services; Facilities; Travel and entertainment; IT and Telecoms etc.
- In the group named ‘Facilities’
- A Category is named ‘Industrial supplies’
- A sub-Category is named ‘Safety glasses’
Following the segmentation of supply items, the risks associated with each Category or sub-Category must be identified. Remember that not having supply of a low cost item can affect the organisation’s revenue to the same extent as not having a high cost item.
The diagram above provides examples of areas for Supply Markets Intelligence (SMI) questions. These provide an understanding of the wider risks associated with the organisation’s supply markets and trade lanes. SMI enables an assessment concerning the resilience of supply markets, the Criticality of the Category or sub-Category for the business and the Vulnerability of the business to the supply of strategic and critical materials. The risks are then scored according to the organisation’s Risk Appetite (type and amount of risk prepared to accept) and Risk Tolerance (expected capability to withstand the risk). Annual spend for an item is not a valid measure, as spend does not equate to risks.
Given the volume of international trade, products purchased domestically will often include materials or items manufactured internationally but sold domestically by country sales divisions of the brand business, importers and agents. Therefore, many global supply risks are within domestic supply.
Under ‘Service Provider’, a risk factor for items is the potential financial and reputation impact on the organisation if the buying process goes wrong. For example, in the ‘Marketing’ spend group, examples of impact types are:
- high impact: product advertising. May require a comprehensive global sourcing plan, with an horizon of three to five years
- medium impact: market research. May require an abridged regional sourcing plan for the next 12-18 months and
- low impact: promotional items (giveaways). May require a country tactical negotiating plan
Similar to the risks for material items, the risks under Service Provider are scored.
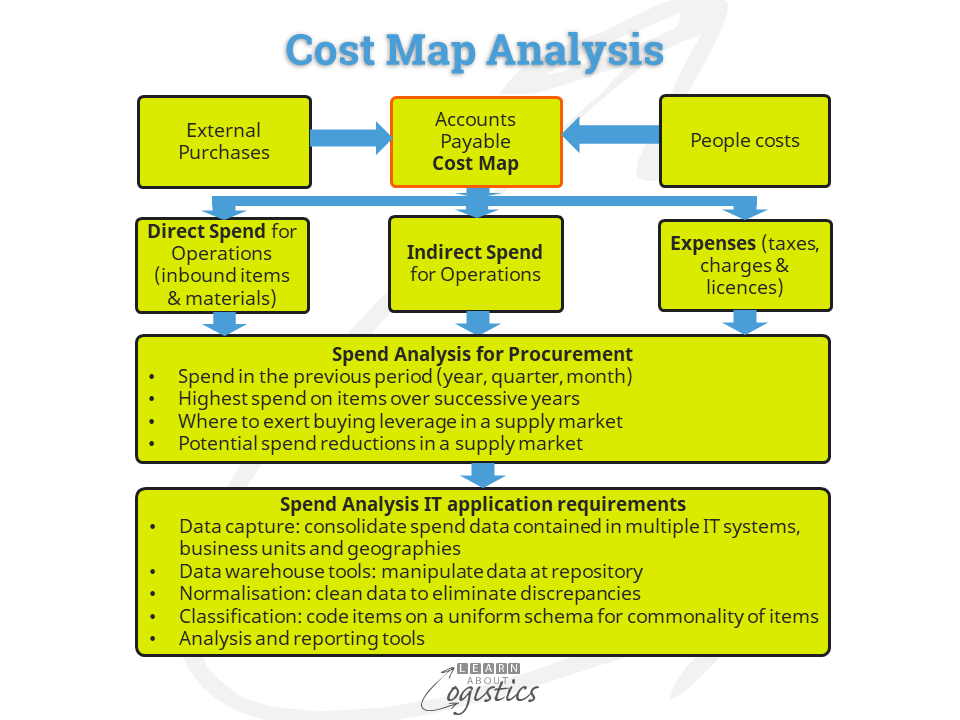
Attention is now paid to the Spend Analysis, which identifies the pattern of spend in Operations (direct and indirect expenditure) for purchased items and individual suppliers. The diagram shows that It relies on the Cost Map analysis, commencing with Accounts Payables. And for the accounts to be cleaned of discrepancies and classified within a coding system for Procurement professionals to have access which has value.
Now that the Spend and Risks associated within inbound supply have been analysed and scored, the items can be located in the ‘Spend – Risk Positioning’ matrix, shown in the diagram below.
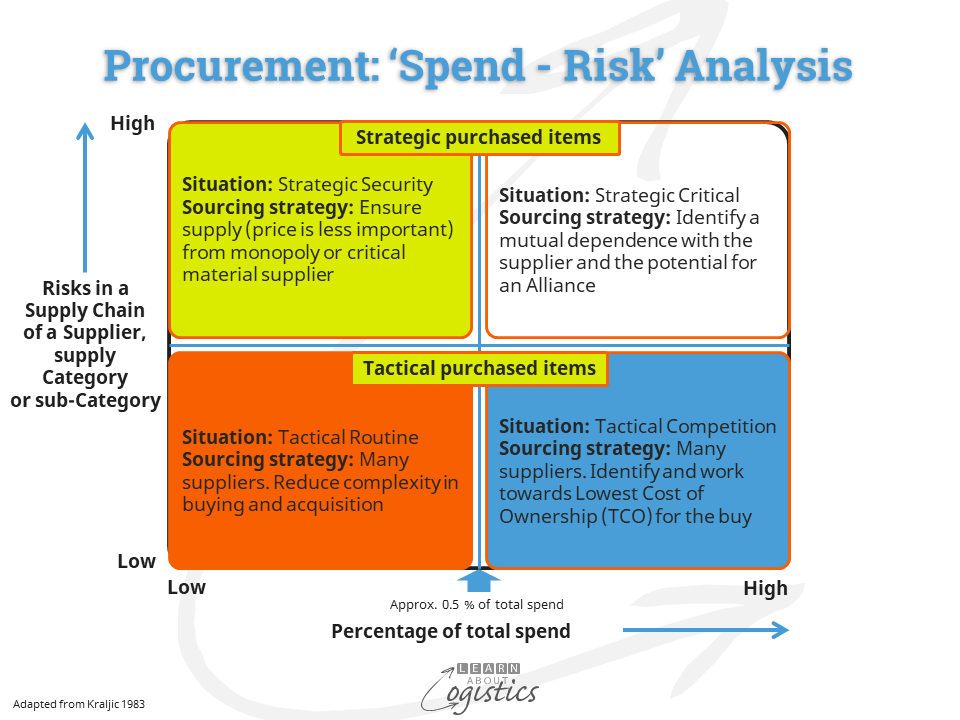
The Spend-Risk analysis identifies the preferred supplier relationship structure required for an item or material. This must be compared with the similar analysis done for Suppliers, discussed in the previous blogpost, to identify the best supplier relationship.
Service Parts
In some businesses, an additional group of inbound material items is Service Parts. These are either for sale to customers as part of the business (mainly in the automotive, white goods, defence and industrial equipment industries), or used within a company’s own facilities as service parts for operational equipment. For example, a large mine site for extracting minerals may hold over 30,000 different service parts, with a need to review more than 100 relevant part numbers per day.
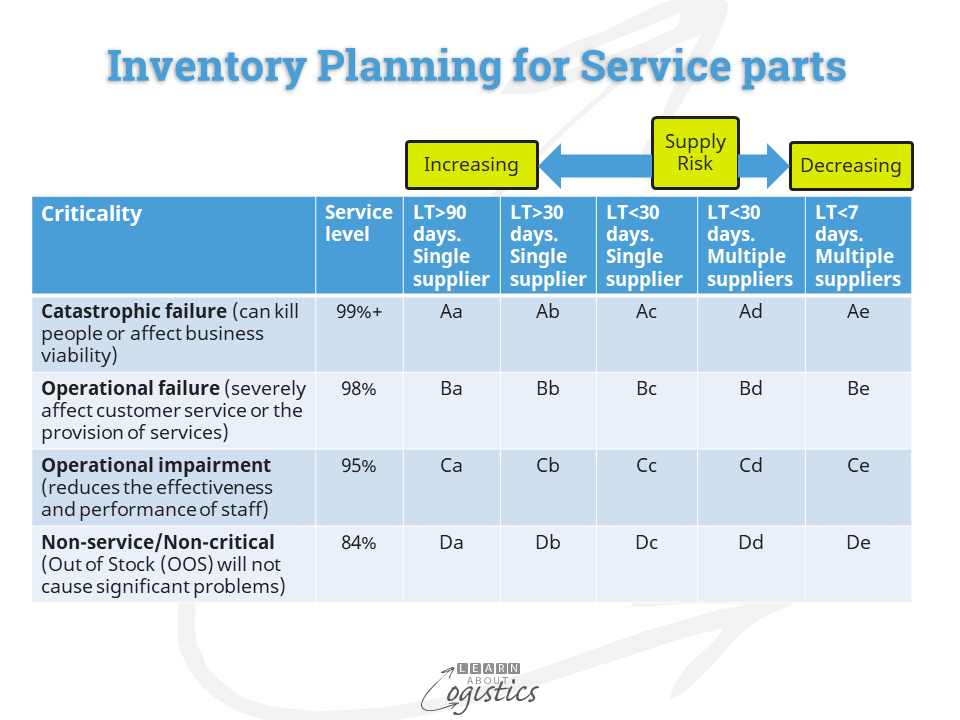
Segmenting service parts inventory is based on the Criticality of each part, as shown in the diagram below. For the more critical parts, the Mean Time Between Failure (MTBF) is calculated from historical records and applied to the part.
Service parts can also be held as ‘insurance parts’ to ensure their availability for an economic life after the finished product is discontinued. These parts are often held in inventory as higher assemblies, such as a full gearbox rather than each of the components. Insurance parts inventory is called ‘life of type’ (LOT) or ‘all time buy’ (ATB).
Service parts held for sale can remain in inventory for extended periods before a sale occurs. Therefore, a business needs to know whether holding the part is earning a return for the company. The calculation for this is the ‘gross margin return on inventory investment’ (GMROII), calculated as: Gross margin x Inventory turns/1 – Gross margin. Given the costs associated with holding inventory, a business should expect to earn up to three dollars for each dollar invested in service parts inventory.
This blogpost illustrates that to develop an understanding the supply markets and a meaningful Sourcing Plan for inbound materials and items requires segmenting the items. Although a business can buy items without following the outlined process, the risk of ‘things going wrong’ increases substantially in an uncertain world.