Supply Chains market segments different from Marketing
In the drive for cost reduction, businesses have emphasised the higher utilisation of machines. This has resulted in no spare capacity on internal equipment, and the outsourcing of manufacturing has also removed capacity buffers. This leaves inventory as the buffer against variability of demands from customers, consumers or internal sources and the supply of items through an organisation’s Supply Chains.
In addition to variable demands from end users, there are variable demands for selected SKUs imposed by Marketing actions. These include new product introductions, product line extensions (that provide the ‘long tail’ of inventory), and product promotions.
Planning inventory therefore requires an approach that identifies SKUs with a stable demand, which require limited buffers of inventory and capacity. This enables sufficient resources to be deployed for managing products with unpredictable and variable demand.
To achieve this outcome require Operations Planning must implement a statistical technique called Coefficient of Variation (CoV). The limitation of constructing ABC groups is that all SKUs within a group are treated the same, even though their pattern of demand may vary. To overcome this limitation, the Coefficient of Variation (CoV) is calculated for each SKU by dividing the standard deviation for each SKU’s sales by the mean of sales.
Coefficient of Variation (CoV)
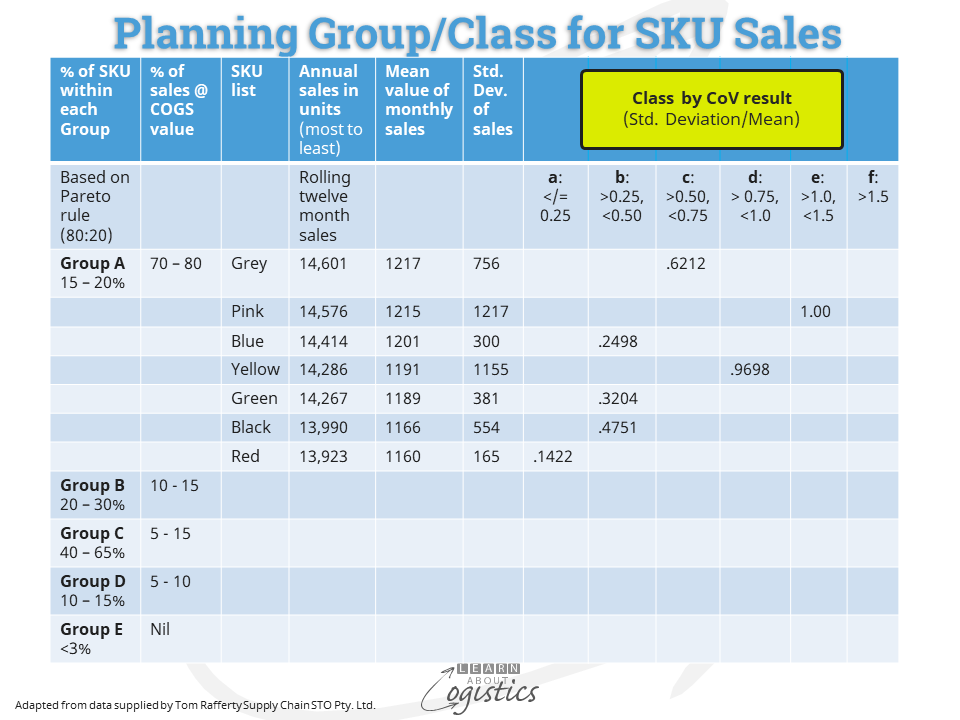
The example table shown below illustrates how the variability of demand identifies an organisation’s supply chains. The process commences with the listing of all SKUs by sales, from highest to lowest. SKUs can include products with seasonal demands and new product releases. Using the Pareto (80:20) rule as the model, the SKUs are split into Groups, but extend the typical ABC groups to Groups A to E, based on the approximate criteria shown in columns 1 and 2 of the Table. In Column 3, place the SKUs within each Group, from highest to lowest, showing their 12 month sales in Column 4.

In this example, the Table shows a business with seven SKUs in Group ‘A’, each named as a colour. It is common that the annual sales figures for each SKU in Group ‘A’ are similar, and it is often assumed that as each SKU has similar sales, so each should receive the same logistics response for high-volume and predictable products; but this is not so. As shown in the example, products with similar annual sales can have different patterns of demand.
The CoV for each SKU is calculated by dividing the standard deviation of sales by the mean of sales. The mean of monthly sales for each SKU is shown in column 5 and the Standard Deviation in column 6. The CoV result for each SKU is then allocated to its Class, from ‘a’ to ‘f’ in columns 7 to 12.
The Table shows that SKUs in Group ‘A’ are identified by their CoV Group/Class: ‘Aa’, ‘Ab’, ‘Ac’, ‘Ad’, ‘Ae’ and if required, ‘Af’. In the example, SKU ‘Red’ is in Class ‘a’, three SKUs (Blue, Green, Black) are in Class ‘b’ and one SKU is in each of Class ‘c’, ‘d’ and ‘e’. Using the same process, the SKUs within Groups B, C, D and E are also allocated to their Class.
In general, business are likely to have their SKUs across the following allocation, with only those with a CoV of less than 0.5 able to be forecast using standard techniques:
- high volume and predictable demand (CoV of less than 0.5) in Class ‘a’ and ‘b’,
- intermittent volume and demand (CoV of 0.5 – 1.0) in Class ‘c’ and ‘d’, and
- low volume and less predictable demand (CoV greater than 1.0) in Class ‘e’ and ‘f’
CoV and management actions
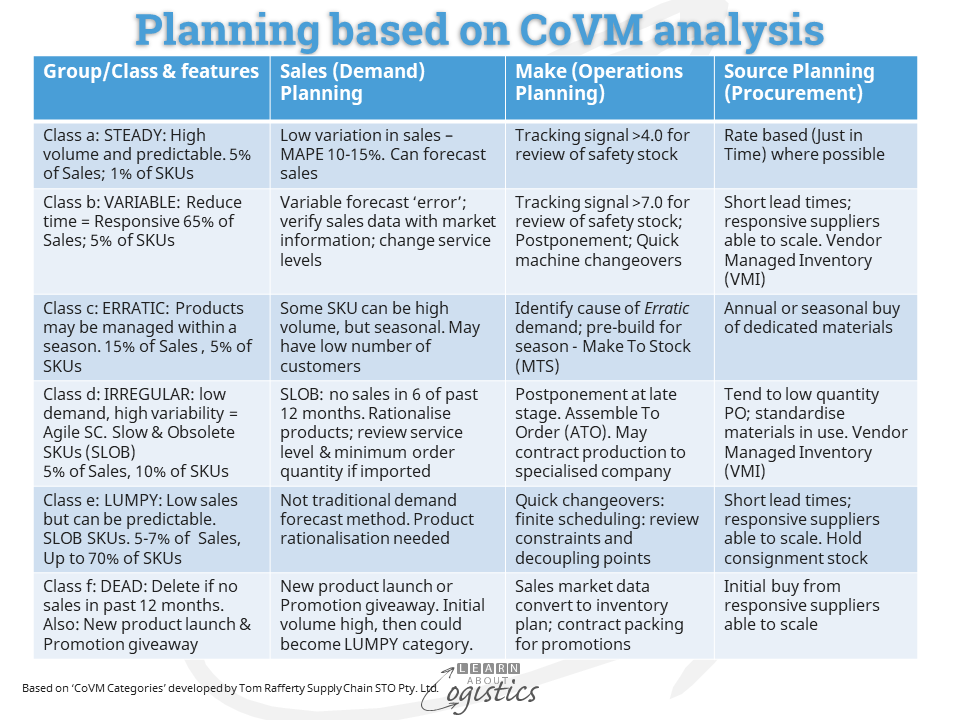
All SKUs are allocated within a Group/Class, or pattern. These patterns of demand provide the structure for differing tactics and actions by the Supply Chains group, under the heading of CoV management or CoVM. For ease of memorising, Tom Rafferty has identified each of the patterns of demand as either: Steady, Variable, Erratic, Irregular, Lumpy or Dead.

For STEADY and VARIABLE Group/Class: Demand is steady with low variation, regardless of the volume sold or used. These SKUs are planned as ‘Make to Stock’ (MTS), so a high service level does not require a high physical safety stock. The mechanism for management is Tracking the accuracy of forecasts, which is calculated as the Cumulative Variance (for each of the periods between forecast and actual sales) divided by the Standard Deviation.
For SKUs in the STEADY Group/Class, a Tracking Signal of less than 4.0 indicates the SKU forecast is in control. In the VARIABLE Group/Class, this calculated figure will be up to 7.0. When the Tracking Signal exceeds 4.0 for STEADY and 7.0 for VARIABLE, it is the trigger for a review of the forecast parameters, including the allocated service level.
SKUs in the ERRATIC Group/Class can have substantial sales, but monthly volumes vary substantially. Sale of these products is often to a small number of customers. Logistics must work with Sales to understand the drivers for each customer’s pattern of orders (such as seasonal) and causes of variability.
The Group/Classes of IRREGULAR (purchased by customers in small quantities on an irregular basis), LUMPY (up to 70 percent of SKUs) and DEAD are called ‘Slow and Obsolete’ (or SLOB). They often have too much inventory sitting in warehouses gathering dust and costing money. For example, at one company it was 4 percent of sales value but 24 percent of inventory value.
The SKUs in these Group/Class cannot be forecast using standard time-series forecasting techniques and less than 20 percent of SKUs can be forecast using traditional approaches. But, as many companies use these forecasting techniques for all SKUs, excess safety stock is more likely, with associated inventory risks.
Marketing usually resists the rationalising of product lines, therefore the Supply Chains group must have a product line elimination strategy as part of the inventory management process. New product launches, promotions and give-aways must have the total cost identified and tracked.
Other things to consider
While CoV is a logical approach to structuring SKU inventory and logistics tactics, additional decision criteria may be used to place an SKU in a Group/Class. Depending on the business and type of products, these may include:
- total cost of ownership for the SKU
- total cost of a stock-out for the SKU (including reputational damage)
- product range integrity – to obtain the sale of a fast-moving SKU, particular slow-moving items must also be available to make a ‘packaged’ sale. These assumptions must be questioned
- physical size of the finished product
- risk of pilferage for the SKU or input materials
- shelf life and batch control requirements
- availability of specialist resources for the SKU to be produced
- storage requirements for finished products or materials e.g. very low temperature
- engineering or technical design complexity for SKU modifications
- Procurement risks are high when buying specific materials or components
The process to identify the Group/Class for SKUs is the start of segmenting and defining your organisation’s outbound supply chains, with each having its own flows of production, inventory and delivery characteristics. Organising SKUs into this structure provides the means to establish an inventory policy for your organisation, based on facts rather than opinions.

