
Why is a Map needed?
The network of suppliers and customers for your organisation will not become ‘integrated’, because each is an independent organisations with their own business objectives and policies. The need is therefore to build a ‘body of knowledge’ about customers, suppliers and the supply markets on which your organisation relies.
An assumption can be that by acquiring an input from a number of Tier 1 suppliers, supply risk has been reduced. But less known is from where the Tier 1 suppliers (which can be located domestically) obtain their inputs and so on through the Tiers of suppliers. Although the product is available from several suppliers, each is reliant on one or a few suppliers at Tier 3 or 4. Examples are: speciality alloys, special purpose adhesives and coatings and substrates used in packaging. Supply to Tier 2 suppliers can stop without your organisation being aware of the cause.
So, the challenge for supply chain professionals is to understand how the demand and supply chains are currently structured and operate, the associated risks and potential for disruptions. This ‘knowledge bank’ is contained in the Supply Chains Network Design Map, also called the Supply Chains Map.
What is in the Map?
The corporate ERP system will contain header information and transaction details concerning each Tier 1 supplier. But it is unlikely to hold the location and operational details of the supplier’s factories that provide the required items. It is this level of detail required for the Supply Chains Map.
The Supply Chains Map is developed from Flows that ideally travel between the customer’s customers and the farms and mines where the materials commence. Flows are identified by the transfer of inbound supply items and outbound products through transport Links between physical Nodes of a supply chain.
- Nodes: are each location that holds material items, money, data or information. Identify the suppliers’ manufacturing and warehouse/distribution centre locations (including outsourced) and the customers’ warehouse and distribution facility locations. Note their capability, including capacity and responsiveness. Also identify transport Nodes, such as sea and airports, transport hubs and intermodal terminals. Note constraints such as load capacity and container/pack size limitations.
- Flows between Nodes may contain time periods, or ‘buckets’ to allow for seasonality and inventory pre-build. Product Platforms are used to identify similar products, based on the capacity of Constraint resources within Operations. Capacity is expressed as a standard unit of measure linked to the Constraint resource e.g. tonnes, shippers, litres, hours, pallets, loads etc.
- Variables: factors that can change the physical or financial value of items and money at a Node
- Links: movements of materials and items by transport mode between Nodes. Identify features such as: seasonal and other demand patterns; lead times; cross-border requirements; potential bottlenecks and wait times at country borders and organisations that own, control or influence critical Links.
- Time to Recover (TTR): expected if critical supplier Nodes or transport Links become unavailable
For outbound supply chains there is additional information supplied by Marketing concerning the ‘competitive edge’ of the business: Order Qualifiers and Winners; Customer Service expectations; Latency of order and delivery data and customer requirements (e.g. omni-channel distribution and product variants).
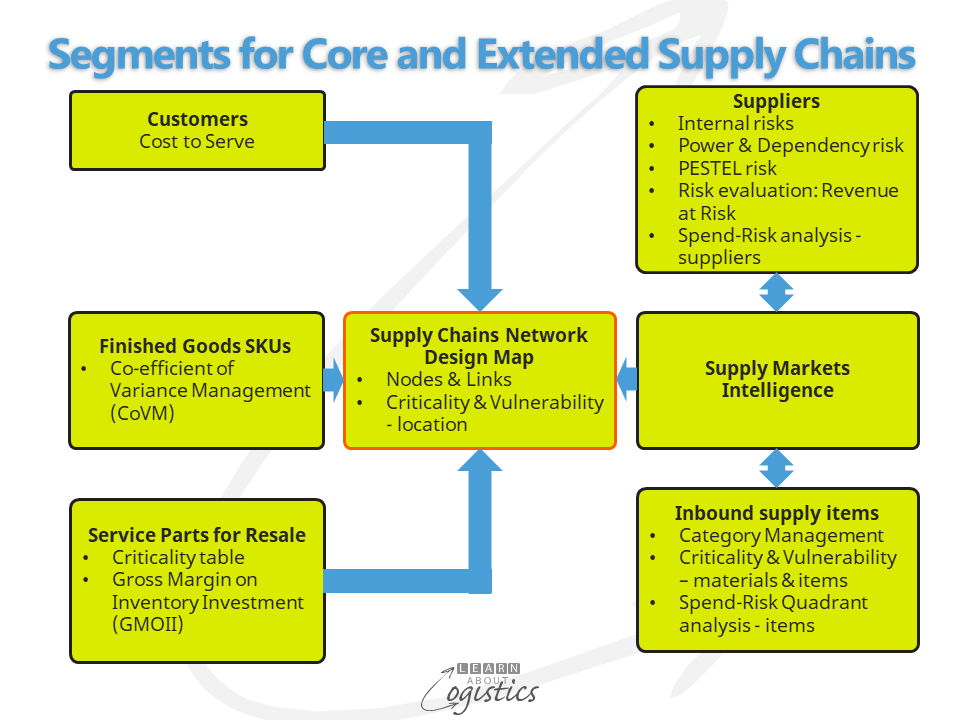
Additional data and information is obtained from the Segmentation analysis of elements within supply chains, that have been discussed in previous blogposts: Customers, Suppliers, Outbound SKUs and Inbound supply items, as shown in the diagram.
The Supply Chains Map can be shown either as a geographical or abstract design. The first step in the Supply Chains Mapping process is to ‘reverse engineer’ your organisation’s products. This is to identify all items – component parts, materials or ingredients, that are supplied, down to the lowest Tier of supply.
Construct the Map
The construction of the Map is led by Procurement for inbound supply and Logistics for outbound distribution. It commences with the locations of Tier 1 suppliers; owned and contracted production and distribution locations; noting the linkages between Tiers 1,2 and 3 suppliers and between customer’s customers.
The objective is to trace materials and parts to the site where they are manufactured. This ‘part-site’ mapping enables your organisation to know which intermediate goods, parts or materials could be delayed by a disruption affecting a specific site.
The ‘reverse engineer’ step enables an extended Bill of Materials to be constructed for each product group. Against each material and item is a risk rating score that identifies how Critical the material/item is to the business and how Vulnerable the business is to supply of the material/item. Do not use annual spend for an item or with a supplier as a measure – spend does not equate to risks.
The Supply Chains Map for your organisation is input to the Sales & Operations Plan, so will require the capture of data needed for planning the business. Examples are:
- Locations: ownership, control or influence at Nodes and Links; contractual responsibilities at Nodes and Links; risk from storms, floods and forest/bushfires and a plan for facilities to withstand the events; plan for power requirements supplied using renewable technologies and capacity to comply with pollution laws
- Materials: inventory form and function at locations; conflict minerals identification
- Measurements: such as order and delivery latency; lead times, inventory and shortages, which vary depending on demand and supply uncertainties
- Environment, Social and Governance (ESG) legislation compliance
The Map will also be updated by changes to the business:
- Mergers and Acquisitions (M&A) that may increase the complexity of supply chains
- Expanding the business to sell products in additional countries
- Substantial change to demands within countries and regions
- Changes to regulations that affect supply chains
Within the Supply Risk policy, the inbound supply items with a high-risk rating score are identified (use the Pareto 20-80 rule) and investigated for their possible sources and risks to supply. The lower the supply Tier for the material or item, the more difficult it is to influence any changes directly with the Tier 1 suppliers. However, the knowledge gained enables planning to commence for alternative materials and supply chains.
Your organisation’s Supply Chains Map is a ‘living’ document, which reflects the current supplier and customer network to enable product Availability for customers and consumers. The Supply Chains Map is therefore regularly updated, to ensure that it reflects the changing situation in supply chains.
Please note: Learn About Logistics will take a mid-year vacation/holiday. The next blogpost will be on September 2. Thank you for reading the blog.