Inventory balances sales and supply.
To become more competitive, management continue to make their organisations more efficient. But this has made their Supply Chains more complex. These competitive initiatives have ranged across: increased item (SKU) numbers, additional sales channels, quicker delivery times, outsourcing, global sourcing and low cost country sourcing.
As complexity has increased, the processes and IT applications used to plan and manage the core Supply Chains have not changed to the extent needed. Logistics typically remains a cost minimisation function rather than part of a value adding Supply Network group (with Procurement and Material Conversion).
An example of a cost minimisation focus is inventory. The situation with the three levels of Inventory Management is:
- Inventory control continues to have an accounting flavour – the amount and value of each stock keeping unit (SKU) and the total value of all items
- Inventory planning is too often seen as a stock replenishment exercise and
- Inventory policy within a Logistics strategy is rarely done
Increased outsourcing, contract manufacturing and production efficiency in owned facilities has meant that using production facilities as a buffer to absorb volatility in demand and supply is not commonly available. Inventory is therefore the critical buffer, requiring a strategic focus by professional Logisticians.
How much inventory is required?
In many organisations, this fundamental question is waiting to be answered. The approach to inventory remains financial – what value of inventory does the Balance Sheet allow. But this thinking is not compatible with the increasing complexity of Supply Chains.
‘Better forecasting’ is an often used statement as the way to reduce inventory. Better forecasting is assumed to need less inventory as a buffer against under- forecasting. But with more products appealing to niche consumers, there is potentially more volatility in demand, therefore less opportunity to achieve ‘better’ forecasts.
Instead, commence to analyse your inventory and from the analysis build a decision structure to better manage SKUs.
In last weeks blog, I noted the use of MAPE and Tracking Signal to measure forecast accuracy. To assist the forecasting task and inventory planning (increased stock-turns and reduced stock-outs), improve the ABC analysis of inventory Categories and calculate the Coefficient of Variation (CoV) for each SKU. This approach identifies the variability in sales patterns of items.
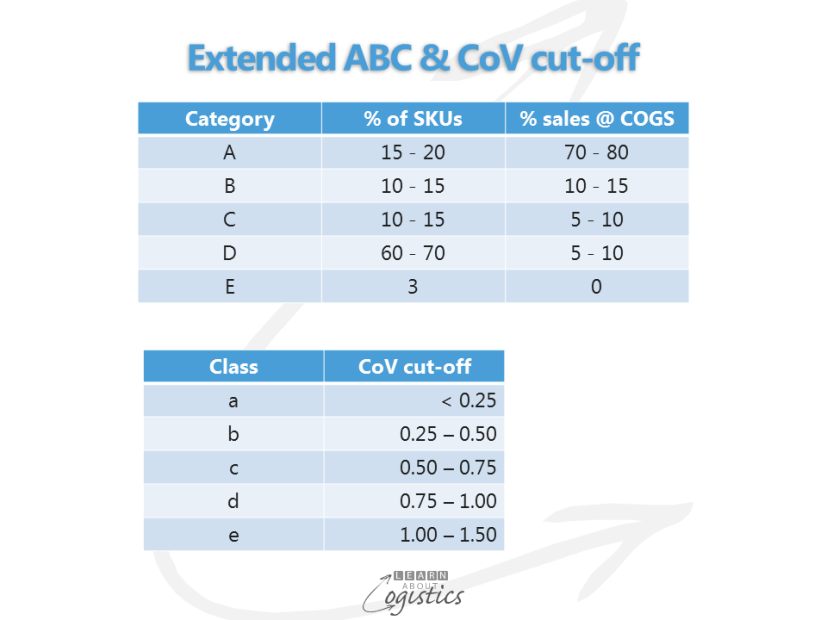
The standard ABC analysis assumes the pattern of sales for the 15 – 20 percent of items in Category A (also items in Categories B and C) will be similar. Therefore all SKUs within the Category are treated the same, even though the pattern of demand will vary. To overcome this limitation, a methodology called CoV Management (CoVM) has been developed by Tom Rafferty at Supply Chain STO (tom@stogroup.com.au). The approach is to first extend the inventory Categories from ABC to A through to E. The second step is to calculate the CoV of each SKU, to identify the variability of sales.
The CoV for a SKU is calculated by dividing the standard deviation of weekly sales (over at least the past twelve months) by the mean of the SKU’s sales. The resulting CoV (that is, the variability) for each SKU is then allocated to one of five classes, according to the CoV cut-off, shown in the diagram. The lower the CoV, the more consistent are sales and conversely, the higher the CoV, the greater the variability of sales for that SKU.

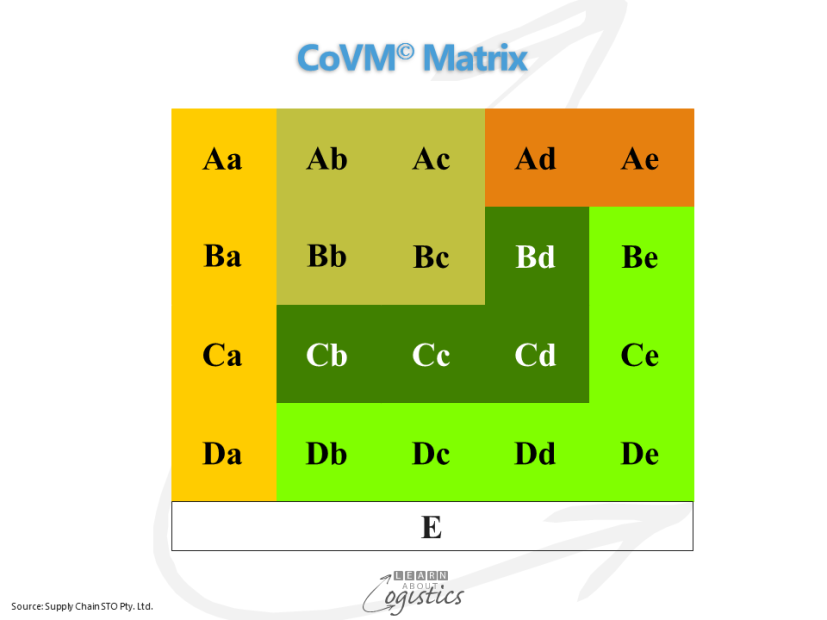
You are now in the position to compare data sets that have different means and standard deviations. Classify the relative values for each SKU then combine with the extended ABC Categories to give a true two-dimensional view if the data. In the base model shown in the diagram below, there are 20 active cells and for example, cells Aa, Ba, Ca and Da have similar sales patterns and therefore should be managed in a similar manner. The number of cells can be increased to reflect specific situations of a business or product range.

The CoVM process is not a set and forget; if your business experiences cyclical demand patterns or has rising or falling sales, preferably recalculate quarterly the CoV for all SKUs, or at the very least, twice per year. Now that inventory is identified within the CoVM matrix, the next step is to structure a management policy for each group of cells; this is the topic of my next Blog.

